Hi everyone, today I want to write about the Prometheus Exporter for the Proxmox hypervisor and try it out on the DevOpsTribe lab. First, I’ll share the link to the GitHub repo. I was thinking about how to deploy it, and I decided to use this guide: https://github.com/prometheus-pve/prometheus-pve-exporter/wiki/PVE-Exporter-on-Proxmox-VE-Node-in-a-venv, which also includes the SystemD unit.
The steps are quite simple.
python3 -m venv /opt/prometheus-pve-exporter
/opt/prometheus-pve-exporter/bin/pip install prometheus-pve-exporter

# Check the installation with: /opt/prometheus-pve-exporter/bin/pve_exporter --help
Once the Python module is installed, I can set up the configuration file for the exporter, and I also need a user dedicated to read-only access.
I have created a prometheus user
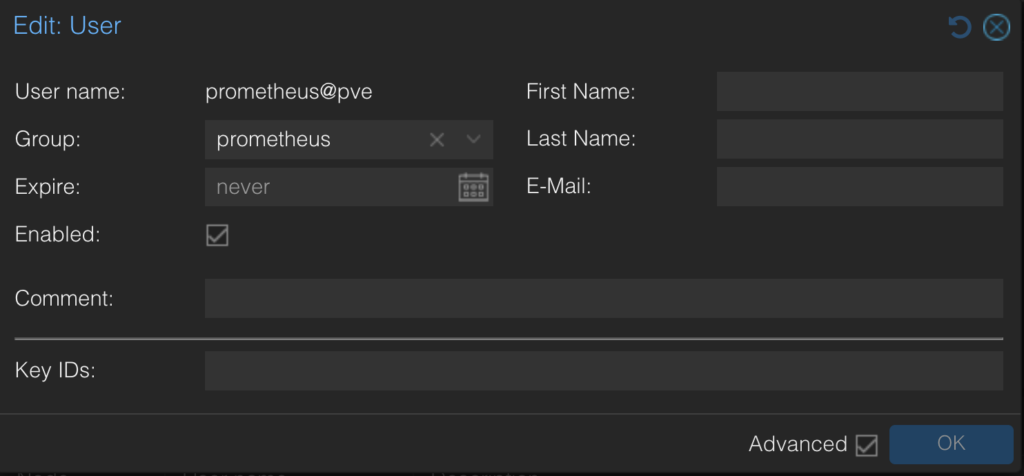
As described in the exporter’s documentation, it’s fine to assign the PVEAuditor role to the user, and I have configured the pve.yml file
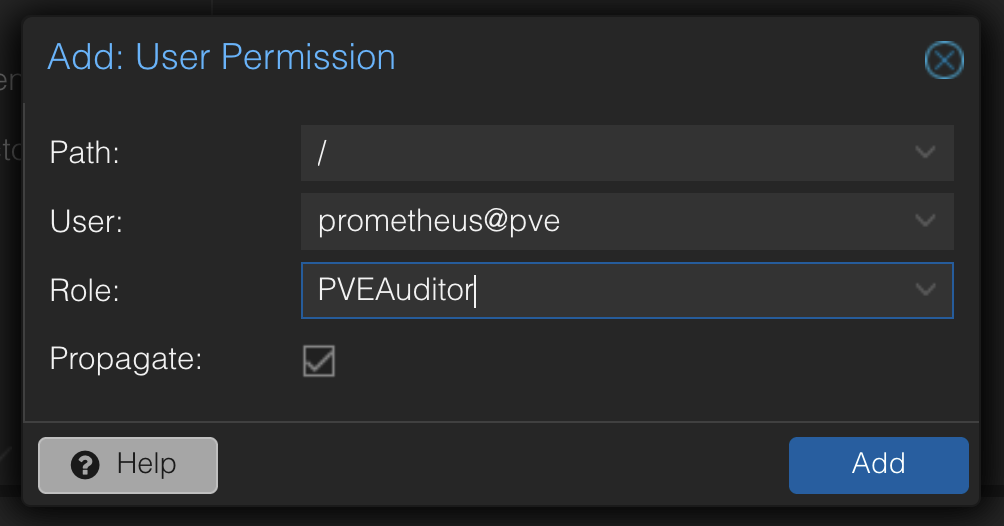
Now, I can create the pve.yml file in /etc/prometheus/pve.yml.
$ root@ns304365 (~) > cat /etc/prometheus/pve.yml
$ root@ns304365 (~) > cat /etc/prometheus/pve.yml
default:
    user: prometheus@pve
    password: ****
    verify_ssl: false
# I used the password but you can use also an API token
This is the SystemD service unit, located at /etc/systemd/system/prometheus-pve-exporter.service.
$ root@ns304365 (~) > cat  /etc/systemd/system/prometheus-pve-exporter.service
[Unit]
Description=Prometheus exporter for Proxmox VE
Documentation=https://github.com/znerol/prometheus-pve-exporter

[Service]
Restart=always
User=prometheus
ExecStart=/opt/prometheus-pve-exporter/bin/pve_exporter --config.file /etc/prometheus/pve.yml

[Install]
WantedBy=multi-user.target
Once the file is created, you need to reload the daemon’s configuration and start the service.
systemctl daemon-reload
systemctl start prometheus-pve-exporter
You can test if the exporter is working properly using curl.
$ root@ns304365 (~) > curl localhost:9221/pve
# HELP pve_up Node/VM/CT-Status is online/running
# TYPE pve_up gauge
pve_up{id="node/ns304365"} 1.0
pve_up{id="qemu/100"} 1.0
pve_up{id="qemu/101"} 1.0
pve_up{id="qemu/9000"} 0.0
pve_up{id="storage/ns304365/local"} 1.0
# HELP pve_disk_size_bytes Storage size in bytes (for type 'storage'), root image size for VMs (for types 'qemu' and 'lxc').
# TYPE pve_disk_size_bytes gauge
pve_disk_size_bytes{id="qemu/100"} 3.221225472e+010
pve_disk_size_bytes{id="qemu/101"} 5.36870912e+010
pve_disk_size_bytes{id="qemu/9000"} 1.073741824e+010
pve_disk_size_bytes{id="node/ns304365"} 2.0940804096e+010
pve_disk_size_bytes{id="storage/ns304365/local"} 2.7177187328e+011
# HELP pve_disk_usage_bytes Used disk space in bytes (for type 'storage'), used root image space for VMs (for types 'qemu' and 'lxc').
# TYPE pve_disk_usage_bytes gauge
pve_disk_usage_bytes{id="qemu/100"} 0.0
pve_disk_usage_bytes{id="qemu/101"} 0.0
pve_disk_usage_bytes{id="qemu/9000"} 0.0
pve_disk_usage_bytes{id="node/ns304365"} 1.9636924416e+010
pve_disk_usage_bytes{id="storage/ns304365/local"} 1.93465360384e+011
# HELP pve_memory_size_bytes Number of available memory in bytes (for types 'node', 'qemu' and 'lxc').
# TYPE pve_memory_size_bytes gauge
pve_memory_size_bytes{id="qemu/100"} 4.294967296e+09
pve_memory_size_bytes{id="qemu/101"} 1.2884901888e+010
pve_memory_size_bytes{id="qemu/9000"} 8.589934592e+09
pve_memory_size_bytes{id="node/ns304365"} 1.6759209984e+010
# HELP pve_memory_usage_bytes Used memory in bytes (for types 'node', 'qemu' and 'lxc').
# TYPE pve_memory_usage_bytes gauge
pve_memory_usage_bytes{id="qemu/100"} 3.226718208e+09
pve_memory_usage_bytes{id="qemu/101"} 1.0086023168e+010
pve_memory_usage_bytes{id="qemu/9000"} 0.0
pve_memory_usage_bytes{id="node/ns304365"} 1.569089536e+010
# HELP pve_network_transmit_bytes The amount of traffic in bytes that was sent from the guest over the network since it was started. (for types 'qemu' and 'lxc')
# TYPE pve_network_transmit_bytes gauge
pve_network_transmit_bytes{id="qemu/100"} 8.446923247e+010
pve_network_transmit_bytes{id="qemu/101"} 1.2573177635e+010
pve_network_transmit_bytes{id="qemu/9000"} 0.0
# HELP pve_network_receive_bytes The amount of traffic in bytes that was sent to the guest over the network since it was started. (for types 'qemu' and 'lxc')
# TYPE pve_network_receive_bytes gauge
pve_network_receive_bytes{id="qemu/100"} 2.1083896353e+010
pve_network_receive_bytes{id="qemu/101"} 7.7540201276e+010
pve_network_receive_bytes{id="qemu/9000"} 0.0
# HELP pve_disk_write_bytes The amount of bytes the guest wrote to its block devices since the guest was started. This info is not available for all storage types. (for types 'qemu' and 'lxc')
# TYPE pve_disk_write_bytes gauge
pve_disk_write_bytes{id="qemu/100"} 1.91578735104e+011
pve_disk_write_bytes{id="qemu/101"} 5.312994432e+011
pve_disk_write_bytes{id="qemu/9000"} 0.0
# HELP pve_disk_read_bytes The amount of bytes the guest read from its block devices since the guest was started. This info is not available for all storage types. (for types 'qemu' and 'lxc')
# TYPE pve_disk_read_bytes gauge
pve_disk_read_bytes{id="qemu/100"} 1.578918018804e+012
pve_disk_read_bytes{id="qemu/101"} 5.544803722e+09
pve_disk_read_bytes{id="qemu/9000"} 0.0
# HELP pve_cpu_usage_ratio CPU utilization (for types 'node', 'qemu' and 'lxc').
# TYPE pve_cpu_usage_ratio gauge
pve_cpu_usage_ratio{id="qemu/100"} 0.0685821712501984
pve_cpu_usage_ratio{id="qemu/101"} 0.132691592201471
pve_cpu_usage_ratio{id="qemu/9000"} 0.0
pve_cpu_usage_ratio{id="node/ns304365"} 0.148930720962991
# HELP pve_cpu_usage_limit Number of available CPUs (for types 'node', 'qemu' and 'lxc').
# TYPE pve_cpu_usage_limit gauge
pve_cpu_usage_limit{id="qemu/100"} 1.0
pve_cpu_usage_limit{id="qemu/101"} 6.0
pve_cpu_usage_limit{id="qemu/9000"} 4.0
pve_cpu_usage_limit{id="node/ns304365"} 8.0
# HELP pve_uptime_seconds Uptime of node or virtual guest in seconds (for types 'node', 'qemu' and 'lxc').
# TYPE pve_uptime_seconds gauge
pve_uptime_seconds{id="qemu/100"} 8.069085e+06
pve_uptime_seconds{id="qemu/101"} 5.448312e+06
pve_uptime_seconds{id="qemu/9000"} 0.0
pve_uptime_seconds{id="node/ns304365"} 8.069122e+06
# HELP pve_storage_shared Whether or not the storage is shared among cluster nodes
# TYPE pve_storage_shared gauge
pve_storage_shared{id="storage/ns304365/local"} 0.0
# HELP pve_ha_state HA service status (for HA managed VMs).
# TYPE pve_ha_state gauge
pve_ha_state{id="qemu/100",state="stopped"} 0.0
pve_ha_state{id="qemu/100",state="request_stop"} 0.0
pve_ha_state{id="qemu/100",state="request_start"} 0.0
pve_ha_state{id="qemu/100",state="request_start_balance"} 0.0
pve_ha_state{id="qemu/100",state="started"} 0.0
pve_ha_state{id="qemu/100",state="fence"} 0.0
pve_ha_state{id="qemu/100",state="recovery"} 0.0
pve_ha_state{id="qemu/100",state="migrate"} 0.0
pve_ha_state{id="qemu/100",state="relocate"} 0.0
pve_ha_state{id="qemu/100",state="freeze"} 0.0
pve_ha_state{id="qemu/100",state="error"} 0.0
pve_ha_state{id="qemu/101",state="stopped"} 0.0
pve_ha_state{id="qemu/101",state="request_stop"} 0.0
pve_ha_state{id="qemu/101",state="request_start"} 0.0
pve_ha_state{id="qemu/101",state="request_start_balance"} 0.0
pve_ha_state{id="qemu/101",state="started"} 0.0
pve_ha_state{id="qemu/101",state="fence"} 0.0
pve_ha_state{id="qemu/101",state="recovery"} 0.0
pve_ha_state{id="qemu/101",state="migrate"} 0.0
pve_ha_state{id="qemu/101",state="relocate"} 0.0
pve_ha_state{id="qemu/101",state="freeze"} 0.0
pve_ha_state{id="qemu/101",state="error"} 0.0
pve_ha_state{id="qemu/9000",state="stopped"} 0.0
pve_ha_state{id="qemu/9000",state="request_stop"} 0.0
pve_ha_state{id="qemu/9000",state="request_start"} 0.0
pve_ha_state{id="qemu/9000",state="request_start_balance"} 0.0
pve_ha_state{id="qemu/9000",state="started"} 0.0
pve_ha_state{id="qemu/9000",state="fence"} 0.0
pve_ha_state{id="qemu/9000",state="recovery"} 0.0
pve_ha_state{id="qemu/9000",state="migrate"} 0.0
pve_ha_state{id="qemu/9000",state="relocate"} 0.0
pve_ha_state{id="qemu/9000",state="freeze"} 0.0
pve_ha_state{id="qemu/9000",state="error"} 0.0
pve_ha_state{id="node/ns304365",state="online"} 0.0
pve_ha_state{id="node/ns304365",state="maintenance"} 0.0
pve_ha_state{id="node/ns304365",state="unknown"} 0.0
pve_ha_state{id="node/ns304365",state="fence"} 0.0
pve_ha_state{id="node/ns304365",state="gone"} 0.0
# HELP pve_lock_state The guest's current config lock (for types 'qemu' and 'lxc')
# TYPE pve_lock_state gauge
pve_lock_state{id="qemu/100",state="backup"} 0.0
pve_lock_state{id="qemu/100",state="clone"} 0.0
pve_lock_state{id="qemu/100",state="create"} 0.0
pve_lock_state{id="qemu/100",state="migrate"} 0.0
pve_lock_state{id="qemu/100",state="rollback"} 0.0
pve_lock_state{id="qemu/100",state="snapshot"} 0.0
pve_lock_state{id="qemu/100",state="snapshot-delete"} 0.0
pve_lock_state{id="qemu/100",state="suspended"} 0.0
pve_lock_state{id="qemu/100",state="suspending"} 0.0
pve_lock_state{id="qemu/101",state="backup"} 0.0
pve_lock_state{id="qemu/101",state="clone"} 0.0
pve_lock_state{id="qemu/101",state="create"} 0.0
pve_lock_state{id="qemu/101",state="migrate"} 0.0
pve_lock_state{id="qemu/101",state="rollback"} 0.0
pve_lock_state{id="qemu/101",state="snapshot"} 0.0
pve_lock_state{id="qemu/101",state="snapshot-delete"} 0.0
pve_lock_state{id="qemu/101",state="suspended"} 0.0
pve_lock_state{id="qemu/101",state="suspending"} 0.0
pve_lock_state{id="qemu/9000",state="backup"} 0.0
pve_lock_state{id="qemu/9000",state="clone"} 0.0
pve_lock_state{id="qemu/9000",state="create"} 0.0
pve_lock_state{id="qemu/9000",state="migrate"} 0.0
pve_lock_state{id="qemu/9000",state="rollback"} 0.0
pve_lock_state{id="qemu/9000",state="snapshot"} 0.0
pve_lock_state{id="qemu/9000",state="snapshot-delete"} 0.0
pve_lock_state{id="qemu/9000",state="suspended"} 0.0
pve_lock_state{id="qemu/9000",state="suspending"} 0.0
# HELP pve_guest_info VM/CT info
# TYPE pve_guest_info gauge
pve_guest_info{id="qemu/100",name="web01",node="ns304365",tags="",template="0",type="qemu"} 1.0
pve_guest_info{id="qemu/101",name="k8s1",node="ns304365",tags="",template="0",type="qemu"} 1.0
pve_guest_info{id="qemu/9000",name="VM 9000",node="ns304365",tags="",template="1",type="qemu"} 1.0
# HELP pve_storage_info Storage info
# TYPE pve_storage_info gauge
pve_storage_info{content="iso,backup,rootdir,snippets,vztmpl,images",id="storage/ns304365/local",node="ns304365",plugintype="dir",storage="local"} 1.0
# HELP pve_node_info Node info
# TYPE pve_node_info gauge
pve_node_info{id="node/ns304365",level="",name="ns304365",nodeid="0"} 1.0
# HELP pve_version_info Proxmox VE version info
# TYPE pve_version_info gauge
pve_version_info{release="8.3",repoid="c1689ccb1065a83b",version="8.3.0"} 1.0
# HELP pve_onboot_status Proxmox vm config onboot value
# TYPE pve_onboot_status gauge
# HELP pve_replication_duration_seconds Proxmox vm replication duration
# TYPE pve_replication_duration_seconds gauge
# HELP pve_replication_last_sync_timestamp_seconds Proxmox vm replication last_sync
# TYPE pve_replication_last_sync_timestamp_seconds gauge
# HELP pve_replication_last_try_timestamp_seconds Proxmox vm replication last_try
# TYPE pve_replication_last_try_timestamp_seconds gauge
# HELP pve_replication_next_sync_timestamp_seconds Proxmox vm replication next_sync
# TYPE pve_replication_next_sync_timestamp_seconds gauge
# HELP pve_replication_failed_syncs Proxmox vm replication fail_count
# TYPE pve_replication_failed_syncs gauge
# HELP pve_replication_info Proxmox
Now, I need to add the job to my Prometheus configuration. I use Podman, so after modifying the config file, I restart Prometheus with podman restart prometheus.
  - job_name: 'pve'
    static_configs:
      - targets:
        - 10.10.10.1:9221  # Proxmox VE node with PVE exporter.
    metrics_path: /pve
    params:
      module: [default]
      cluster: ['1']
      node: ['1']
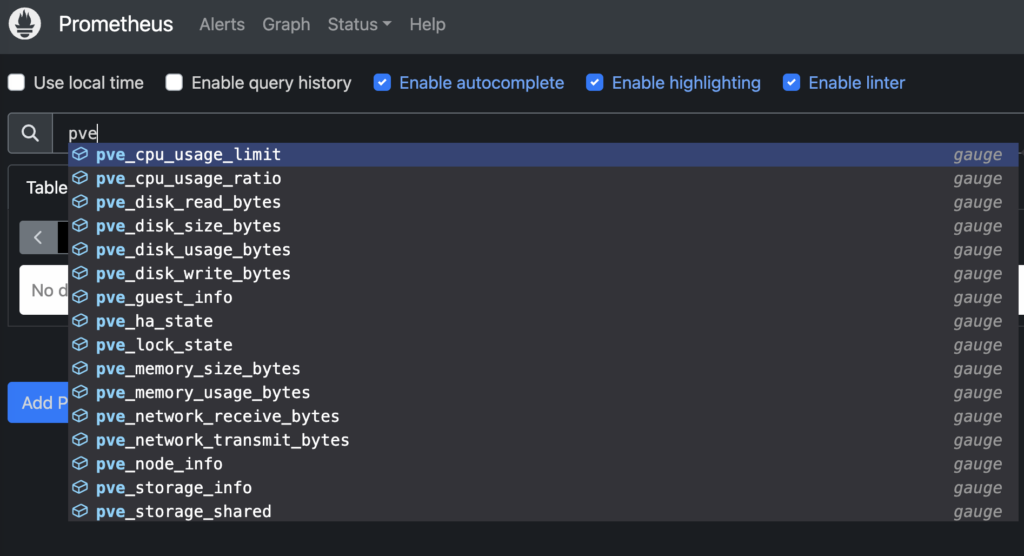
The next step is to check if the metrics are being scraped by Prometheus. In my case, I start an SSH tunnel to reach Prometheus with the command: ssh -L 9090:localhost:9090 web01.
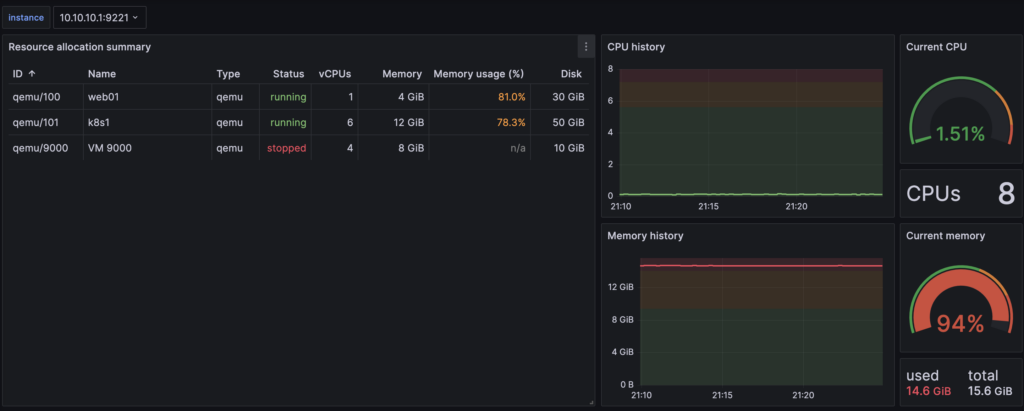
It’s time to get a Grafana dashboard. I found one here: https://grafana.com/grafana/dashboards/10347-proxmox-via-prometheus/, which is linked in the exporter’s GitHub repo.
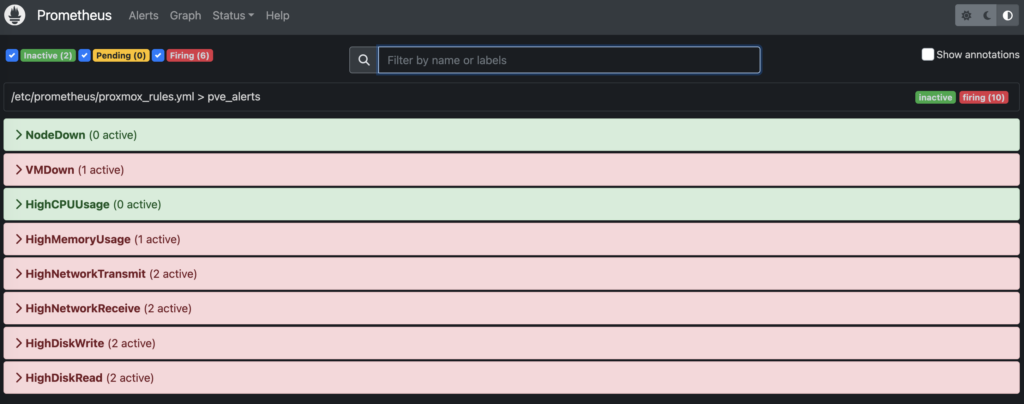
Okay, the dashboard looks good, but alerts matter, so I need to configure Prometheus rules. I tried using an LLM to help me and used GPT-4 via Copilot on VSCode. The results were partially okay, so I had to adjust a few things, like the indentation.
To trigger instantanly the alerts I set to 1 Byte the threshold of some expresions in order to see the firing alerts.
groups:
- name: pve_alerts
  rules:
  - alert: NodeDown
    expr: pve_up{id=~"node/.*"} == 0
    for: 1s
    labels:
      severity: critical
    annotations:
      summary: "Node {{ $labels.id }} is down"
      description: "Node {{ $labels.id }} has been down for more than 5 minutes."

  - alert: VMDown
    expr: pve_up{id=~"qemu/.*"} == 0
    for: 1s
    labels:
      severity: critical
    annotations:
      summary: "VM {{ $labels.id }} is down"
      description: "VM {{ $labels.id }} has been down for more than 5 minutes."

  - alert: HighCPUUsage
    expr: pve_cpu_usage_ratio > 0.9
    for: 1s
    labels:
      severity: warning
    annotations:
      summary: "High CPU usage on {{ $labels.id }}"
      description: "CPU usage on {{ $labels.id }} is above 90%."

  - alert: HighMemoryUsage
    expr: (pve_memory_usage_bytes / pve_memory_size_bytes) > 0.9
    for: 1s
    labels:
      severity: warning
    annotations:
      summary: "High memory usage on {{ $labels.id }}"
      description: "Memory usage on {{ $labels.id }} is above 90%."

  - alert: HighNetworkTransmit
    expr: pve_network_transmit_bytes{id=~"qemu/.*"} > 1.0
    for: 1s
    labels:
      severity: warning
    annotations:
      summary: "High network transmit on VM {{ $labels.id }}"
      description: "Network transmit on VM {{ $labels.id }} is above 1 Byte."

  - alert: HighNetworkReceive
    expr: pve_network_receive_bytes{id=~"qemu/.*"} > 1.0
    for: 1s
    labels:
      severity: warning
    annotations:
      summary: "High network receive on VM {{ $labels.id }}"
      description: "Network receive on VM {{ $labels.id }} is above 1 Byte."

  - alert: HighDiskWrite
    expr: pve_disk_write_bytes{id=~"qemu/.*"} > 1.0
    for: 1s
    labels:
      severity: warning
    annotations:
      summary: "High disk write on VM {{ $labels.id }}"
      description: "Disk write on VM {{ $labels.id }} is above 1 Byte."

  - alert: HighDiskRead
    expr: pve_disk_read_bytes{id=~"qemu/.*"} > 1.0
    for: 1s
    labels:
      severity: warning
    annotations:
      summary: "High disk read on VM {{ $labels.id }}"
      description: "Disk read on VM {{ $labels.id }} is above 1 Byte."
Obviously, some metrics and rules are already included in Node Exporter, but it’s interesting to have a single view that monitors the hypervisor.
Conclusions
In conclusion, I can say that monitoring Proxmox hypervisors via Prometheus is a great idea for gaining additional controls beyond Node Exporter and other exporters. Naturally, I recommend using a Prometheus + Alertmanager cluster in HA, located outside the monitored hypervisors. Perhaps the exporter could be expanded with additional metrics, and it would be useful to experiment with automated actions triggered by certain alerts.